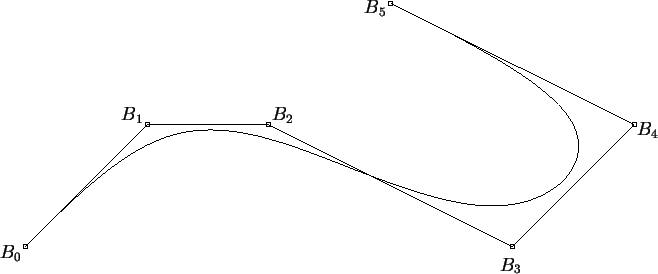
An easy way of making a controlled-design curve with many
control points is to use B-spline curves. The ones we shall
discuss are called relaxed uniform cubic B-spline curves. You
start by specifying a control polygon of points
![]() , and you end by getting a curve like the one in
Figure
, and you end by getting a curve like the one in
Figure ![]() .
.
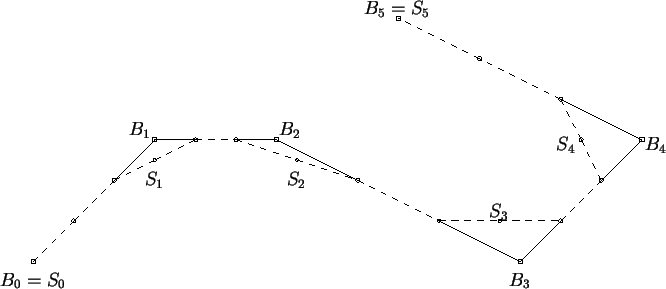
Here is the method, if done by hand: Divide each leg of
the control polygon in thirds by marking two ``division'' points.
At each ![]() except the first and last, draw the line
segment between the two nearest ``division'' points, and call the
midpoint
except the first and last, draw the line
segment between the two nearest ``division'' points, and call the
midpoint ![]() . Then you have made an A-frame with
. Then you have made an A-frame with ![]() at the apex, as shown. For completeness, let
at the apex, as shown. For completeness, let ![]() and
and
![]() . See if you can locate the four A-frames in Figure
. See if you can locate the four A-frames in Figure
![]() .
.
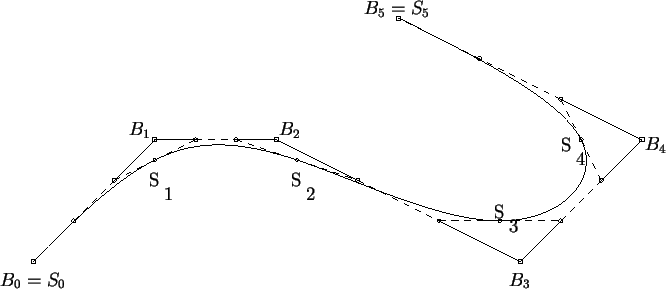
Finally, sketch a cubic Bézier curve from each point ![]() to
the next, using as Bézier control points the four points
to
the next, using as Bézier control points the four points ![]() ,
two ``division'' points, and
,
two ``division'' points, and ![]() , as in Figure
, as in Figure ![]() .
.
As you see, the points of gluing meet the A-frame condition automatically and at the ends the second derivative is zero. Therefore you obtain a relaxed cubic spline curve.
The method as performed on a computer is the same; we merely need to find the Bézier control points in terms of the original B-spline control points:
The ``division'' points on the line segment from ![]() to
to
![]() are
are
![]() and
and
![]() . Also,
. Also,
![]() is the average of the ends of its ``cross-segment'', so that
is the average of the ends of its ``cross-segment'', so that
![]()
![]()
![]() ,
for
,
for
![]() .
.
To summarize the computer method:
Given B-spline control points
![]() , calculate
, calculate ![]()
![]()
![]() , for
, for
![]() , and let
, and let ![]() ,
, ![]() . There are
. There are ![]() Bézier curves to plot;
curve #
Bézier curves to plot;
curve #![]() has control points
has control points ![]() ,
,
![]() ,
,
![]() , and
, and ![]() . On curve #
. On curve #![]() , you can plot
points on the curve for, say,
, you can plot
points on the curve for, say,
![]() .
.
Finally, let's consider the situation mathematically.
Let ![]() be the
be the ![]() th Bézier curve (
th Bézier curve (
![]() ). These
). These ![]() curves can be combined into a single
curve
curves can be combined into a single
curve ![]() for
for
![]() by letting
by letting
![]() for
for
![]() ,
,
![]() for
for
![]() , etc. In general,
, etc. In general,
![]() for
for
![]() , where
, where
![]() .
.
Then ![]() is a relaxed cubic spline curve.
is a relaxed cubic spline curve. ![]() is called a uniform spline curve because its domain
is called a uniform spline curve because its domain
![]() was made from intervals all of length 1.
Non-uniform curves will be considered in Section 10.
was made from intervals all of length 1.
Non-uniform curves will be considered in Section 10.
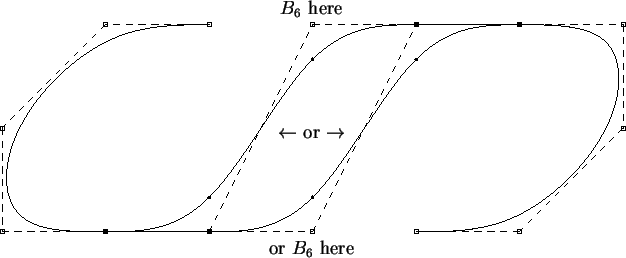
An important virtue of B-spline curves is that the
influence of individual control points is local. In fact, any
one point on the curve is influenced by at most four of the
B-spline control points. The reason is that for Bézier curve
#![]() , all four control points can be computed from a
knowledge of
, all four control points can be computed from a
knowledge of ![]() ,
, ![]() ,
, ![]() , and
, and ![]() . Similarly, control point
. Similarly, control point ![]() influences only
four Bézier-curve segments: the two that join at
influences only
four Bézier-curve segments: the two that join at ![]() and
the two additional ones joined to those. The local effect can be
illustrated by changing a single control point. In Figure
and
the two additional ones joined to those. The local effect can be
illustrated by changing a single control point. In Figure
![]() , two choices of the middle control point are
indicated, along with the corresponding B-spline curves. Dots on
the curves indicate some gluing points
, two choices of the middle control point are
indicated, along with the corresponding B-spline curves. Dots on
the curves indicate some gluing points ![]() .
.
What if you don't want relaxed end conditions? In that
case, you can just use less of the curve, say the part from ![]() to
to ![]() , i.e.,
, i.e.,
![]() .
. ![]() and
and ![]() can still be used as control points to affect the
shape of the part of the curve that you are using.
can still be used as control points to affect the
shape of the part of the curve that you are using.